
Calibration
One of the most important aspects of DeepDive is its iterative workflow. After performing probabilistic inference using DeepDive, it is crucial to evaluate the results and act on the feedback that the system provides to improve the accuracy. DeepDive produces calibration plots to help the user with this task.
Defining a holdout set
To get the most out of calibration, the user should specify either a holdout fraction or a custom holdout query to define a subset of evidence as training data. DeepDive uses the holdout variables to evaluate its accuracy, and no holdout is used by default.
Holdout fraction
When the holdout_fraction is set as below in the application's deepdive.conf file, DeepDive randomly selects the specified fraction of evidence variables, i.e., ones that are labeled can be selected and are held out from training.
deepdive.calibration.holdout_fraction: 0.25
Custom holdout query
DeepDive also supports a SQL query to define the holdout set.
A custom holdout query must insert the internal dd_id column of all variables that are to be held out into the dd_graph_variables_holdout table through an arbitrary SQL.
For example, a custom holdout query can be specified as follows in deepdive.conf:
deepdive.calibration.holdout_query: """
    INSERT INTO dd_graph_variables_holdout(variable_id)
    SELECT dd_id
    FROM mytable
    WHERE predicate
"""
When a custom holdout query is defined as holdout_query, the holdout_fraction setting is ignored.
Inspecting probabilities and weights
To improve the prediction accuracy, it is useful to inspect the probabilities for each variable and the learned factor weights.
DeepDive creates a view called dd_inference_result_weights_mapping which contains the factor names and the learned weights sorted by their absolute values.
The dd_inference_result_weights_mapping view has the following schema:
View "public.dd_inference_result_weights_mapping"
   Column    |       Type       | Modifiers
-------------+------------------+-----------
 id          | bigint           |
 isfixed     | integer          |
 initvalue   | real             |
 cardinality | text             |
 description | text             |
 weight      | double precision |
Specification for these fields:
- id: the unique identifier for the weight
- initial_value: the initial value for the weight
- is_fixed: whether the weight is fixed (cannot be changed during learning)
- cardinality: the cardinality of this factor. Meaningful for categorical factors.
- description: description of the weight, composed by [the name of inference rule]-[the specified value of "weight" in inference rule]
- weight: the learned weight value
Calibration data and plots
DeepDive generates a calibration data file for each variable defined in the schema when the following command is run:
deepdive do model/calibration-plots
They are generated at the path below where each file contains ten lines with the following five columns:
run/model/calibration-plots/[variable_name].tsv
[bucket_from] [bucket_to] [num_predictions] [num_true] [num_false]
DeepDive places the inference results into ten buckets. Each bucket is associated to a probability interval from 0.0 to 1.0. The meaning of the last three columns is the:
num_predictionsis the number of variables in the probability bucket, including both holdout and query variables (variables without any label). Basically,num_predictions=num_holdout+num_unknown_var.num_trueis the number of holdout variables in the probability bucket with the value of true. The number should be high for buckets with large probabilities and small for buckets with small probabilities since the actual value of these variables are true and with high probability they should be predicted as true. Note that in this case only the holdout data is used.num_falseis the number of holdout variables in the probability bucket with the value of false. The number should be small for buckets with large probabilities and large for buckets with small probabilities since the actual value of these variables are false and with low probability they should be predicted as true. Note that in this case only the holdout data is used.
DeepDive also generates an image file called calibration plot for each of the variables defined in schema. The image file is generated next to the calibration data:
run/model/calibration-plots/[variable_name].png
A typical calibration plot looks as follows:
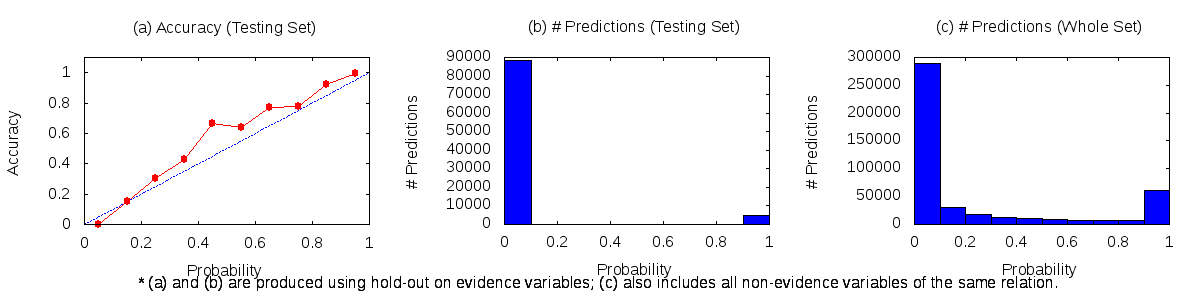
Interpreting calibration plots
The accuracy plot (a) shows the ratio of correct positive predictions for each probability bucket.
Ideally, the red line should follow the blue line, representing that the system finds high number of evidence positive predictions for higher probability buckets and for lower probability buckets the system finds less number of evidence positive predictions linearly.
Which means for probability bucket of 0 there should be no positive prediction, and for 100% bucket all the predictions should be positive.
The accuracy is defined as num_holdout_true / num_holdout_total.
Plots (b) and (c) show the number of total prediction on the test and the training set, respectively. Ideally these plots should follow a U-curve. That is, the system makes many predictions with probability 0 (events that are likely to be false), and many predictions with probability > 0.9 (events that are likely to be true). Predictions in the range of 0.4 - 0.6 mean that the system is not sure, which may indicate that it needs more features to make predictions for such events.
Note that plots (a) and (b) can only be generated if a holdout fraction was specified in the configuration.
Acting on calibration data
There could many factors that lead to suboptimal results. Common ones are:
Not enough features: This is particularly common when a lot of probability mass falls in the middle buckets (0.4 - 0.6). The system may be unable to make predictions about events because the available features are not specific-enough for the events. Take a look at variables that were assigned a probability in the 0.4 to 0.6 range, inspect them, and come up with specific features that would push these variables towards a positive or negative probability.
Not enough positive evidence: Without sufficient positive evidence the system will be unable to learn weights that push variables towards a high probability (or a low probability if the variables are negated). Having little probability mass on the right side of the graph is often an indicator for not having enough positive evidence, or not using features that use the positive evidence effectively.
Not enough negative evidence: Without sufficient negative evidence, or with negative evidence that is biased, the system will not be able to distinguish true events from false events. That is, it will generate many false positives. In the graph this is often indicated by having little probability mass on the left (no U-shape) in plots (b) and (c), and/or by having a low accuracy for high probabilities in plot (a). Generating negative evidence can be somewhat of an art.
Weight learning does not converge: When DeepDive is unable to learn weights for the inference rules the predicated data will be invalid. Check the DeepDive log file for the gradient value at the end of the learning phrase. If the value is very large (1000 or more), then it is possible that weight learning was not successful. In this case, one may try to increase the number of learning iterations, decrease the learning rate, or use a faster decay.
Weight learning converges to a local optimum: The user can try increasing the learning rate, or using a slower decay. Check the DimmWitted sampler documentation for more details.
Recall errors
Recall is the fraction of relevant events that are extracted. In information extraction applications there are generally two sources of recall error:
Event candidates are not recognized in the text. In this case, no variables are created are recall errors and these events do not show up in the calibration plots. For example, the system may fail to identify "micro soft" as a company name if it is lowercase and misspelled. Such errors are difficult to debug, unless there is a complete database to test against, or the user makes a closed-world assumption on the test set.
Events fall below a confidence cutoff. Assuming that one is only interested in events that have a high probability, then events in the mid-range of the calibration plots can be seen as recall errors. For example, if one is interested only in company names that are > 90% confident are correct, then the company names in the buckets below 0.9 are recall errors. Recall can be improved using some of the aforementioned suggestions.